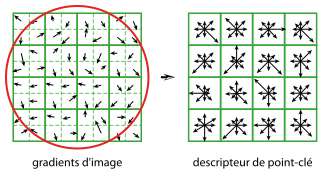
SIFT (Scale-Invariant Feature Transform)
SIFT는 상당히 인기가 많은 인식방법 중 하나인듯하다.
특징점 주변 픽셀들의 gradient 방향, 크기에 대한 히스토그램을 이용해 주변의 분포특성을 표현해 준다. 일단은 기하학적 특징보다는 어쨌든간 방향과 크기에 대한 아래와 같은 변화를 감지하여 인식하는 싱기방기한 인식방법이다.
출처 : https://commons.wikimedia.org/wiki/File:SIFT_gradient_magnitude_and_orientation_computation.svg
참조 : https://en.wikipedia.org/wiki/Scale-invariant_feature_transform
https://gilscvblog.wordpress.com/2013/08/18/a-short-introduction-to-descriptors/
관심점 (Interest points)는 다음과 같은 식을 참조
다음의 SIFT관련 오픈소스를 참조가능하다.
http://www.cs.ubc.ca/~lowe/keypoints/
from PIL import Image
from numpy import *
from scipy.ndimage import filters
import os


def process_image(imagename,resultname,params="--edge-thresh 10 --peak-thresh 5"):

	if imagename[-3:] != 'pgm':
		# create a pgm file
		im = Image.open(imagename).convert('L')
		im.save('tmp.pgm')
		imagename = 'tmp.pgm'
		cmmd = str("siftWin32 "+imagename+" --output="+resultname+
		" "+params)
		os.system(cmmd)
		print ('processed', imagename, 'to', resultname)

def read_features_from_file(filename):
	f = loadtxt(filename)
	return f[:,:4],f[:,4:] # feature locations, descriptors

def write_features_to_file(filename,locs,desc):
	savetxt(filename,hstack((locs,desc)))

def plot_features(im,locs,circle=False):

	def draw_circle(c,r):
		t = arange(0,1.01,.01)*2*pi
		x = r*cos(t) + c[0]
		y = r*sin(t) + c[1]
		plot(x,y,'b',linewidth=2)
		imshow(im)
		if circle:
			for p in locs:
				draw_circle(p[:2],p[2])
		else:
			plot(locs[:,0],locs[:,1],'ob')
			axis('off')

def match(desc1,desc2):
	desc1 = array([d/linalg.norm(d) for d in desc1])
	desc2 = array([d/linalg.norm(d) for d in desc2])
	dist_ratio = 0.6
	desc1_size = desc1.shape
	matchscores = zeros((desc1_size[0],1),’int’)
	desc2t = desc2.T # precompute matrix transpose
	for i in range(desc1_size[0]):
		dotprods = dot(desc1[i,:],desc2t) # vector of dot products
		dotprods = 0.9999*dotprods
		# inverse cosine and sort, return index for features in second image
		indx = argsort(arccos(dotprods))
		# check if nearest neighbor has angle less than dist_ratio times 2nd
		if arccos(dotprods)[indx[0]] < dist_ratio * arccos(dotprods)[indx[1]]:
			matchscores[i] = int(indx[0])
	return matchscores

def match_twosided(desc1,desc2):
	matches_12 = match(desc1,desc2)
	matches_21 = match(desc2,desc1)
	ndx_12 = matches_12.nonzero()[0]
	# remove matches that are not symmetric
	for n in ndx_12:
		if matches_21[int(matches_12[n])] != n:
			matches_12[n] = 0
	return matches_12

imname = 'image.PNG'
im1 = array(Image.open(imname).convert('L'))
process_image(imname,'tmp.pgm')
l1,d1 = read_features_from_file('tmp.pgm')
figure()
gray()
sift.plot_features(im1,l1,circle=True)
show()
어쨌든 위와같은 프로그램으로 돌아가긴 해야되는데, sift 오픈소스 프로그램의 버전업이 되면서 잘 되지는 않는듯 하다. C로 만들어진 프로그램인지라 os.system() 메서드로 바로 호출해서 siftWin32 명령어를 통해서 바로 계산할수 있어야 하는데 argument관련 에러가 난다., 이와관련한 오픈소스는 꽤 많아 보이므로 일단은 넘어가도록 한다.
참고 프로그램
pydot 패키지 (http://code.google.com/p/pydot/)
pyparsing 패키지 (http://pyparsing.wikispaces.com/)
graphviz 패키지 (http://www.graphviz.org/)
아래처럼 시각화해주는데 탁월하다.
'데이터분석 > Vision Recognition' 카테고리의 다른 글
| OpenCV 빠르게 이용해서 얼굴 판별 (0) | 2015.11.10 |
|---|---|
| Microsoft Azure 를 이용한 신박한 머신러닝 (0) | 2015.10.24 |
| ② 파이썬 - 컴퓨터 비전 프로그래밍 (Local Image Descriptor) (1) (0) | 2015.10.03 |
| ① 파이썬 - 컴퓨터 비전 프로그래밍 (Basic Image Handling and Processing) (2) (0) | 2015.10.01 |
| ① 파이썬 - 컴퓨터 비전 프로그래밍 (Basic Image Handling and Processing) (1) (0) | 2015.09.30 |


